
In her latest WARC column, Professor Karen Nelson-Field, founder of Amplified Intelligence, explains how good attention data, in the right use cases, restores efficiency in the models and tools used in everyday marketing.
When thinking about attention measurement most look for a magic number that says XYZ attention units/scores/seconds gets you XYZ conversion. And while this is important, what is perhaps even more important for advertisers to understand is the gravity of the flow-on effects caused by the expansive gap between viewable and viewed impressions. Most have heard attention vendors talking about an ad served and an ad viewed being very different things, but most don’t really understand the impact this ‘expectation versus reality’ has on business efficiency. If humans looking at the ad served is a basic expectation of media trading and the reality is far from this, think about the massive impact this has on other models and tools used in everyday marketing. This is the stuff that erodes the bottom line.
The flow-on effects to share of voice
One such expectation versus reality example was presented by Peter Field at Cannes 2022. He revealed that the value of share of voice as a budgeting tool is now significantly diminished due to the lack of relationship between human attention and each dollar spent. In other words, how much you spend and how many impressions you buy no longer tell us about the likelihood of driving growth because the count of impressions is not the yardstick it once was.
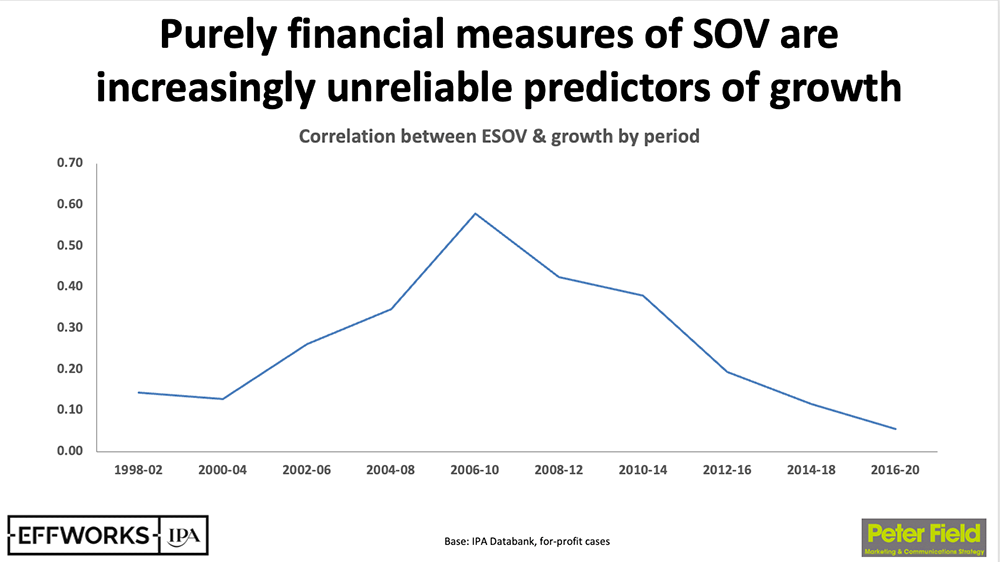
Fig 1. Expectation vs reality: SOV and growth
The flow-on effects to reach curves
A well-used marketing tool that suffers the same expectation vs reality fate is traditional reach curves.
Reach curves were designed to show media planners the relationship between the number of content impressions to the number of people who see the content (relative to budget). It is supposed to represent the total audience reached during the entire duration of an advertisement campaign, but they no longer do what they were built to do thanks to the viewable/viewed mess. This leaves us with a disconnect between ‘reach volume’ and ‘attention volume’. (I have spoken about this before)
Reach volume is what media planners expect to get when you plan media with traditional reach curves. It's the expectation that 100% of the impressions planned/bought are watched by 100% of the audience for 100% of the time. Attention volume, on the other hand, is what you actually get when you plan and buy media. It’s the reality of how humans interact with advertising.
This gap has a huge impact on the reach curve relationship.
Figure 2 shows what happens to a traditional reach curve when accounting for attention volume. It shows how the line moves down drastically when the number of people who have seen the content is in reality a lot lower than you think.
Efficient planning is certainly difficult when the input data doesn't tell you what it is supposed to.
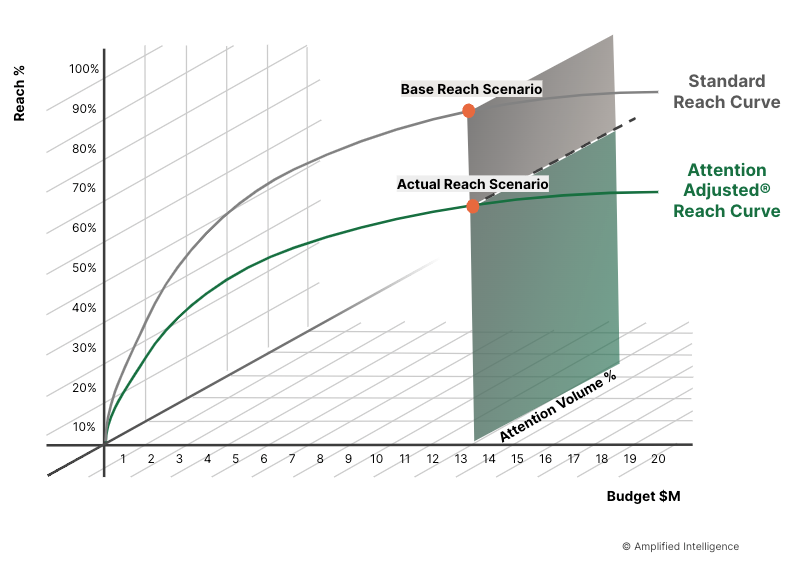
Fig 2. Expectation vs reality: Traditional reach curves and reach
The flow-on effects to branding effectiveness
Media practices aren't the only thing to suffer.
Advertising plays a critical role in creating memorable brand experiences that stay with consumers long after they have viewed the ad. By building strong memory structures the brand is more likely to come to mind when the consumer is in the market to make a purchase.
This is called mental availability and it refers to the distinctiveness and prevalence of a brand name and its associated attributes in a consumer's memory (see Professor Romaniuk’s work).
These associations serve as triggers that bring the brand to mind at specific occasions, such as Budweiser and sports. The stronger these associations are, the more likely the consumer will choose the brand over its competitors when making a purchase at these times. But building these associations is predicated on a) the brand being connected to attributes in the creative, and even more obviously b) the brand being seen at all.
Branding often gets lost in the attention conversation because marketers expect when you buy impressions your brand is being seen. But most don't understand the reality as it relates to reach volume versus attention decay. For the purpose of definition, attention volume is the % of reach that you actually get by impression, attention decay is the distribution that sits underneath this aggregated metric. It is the shape of human viewing behaviour over time, something only human data can reveal.
Why does this matter to branding? Because where you place your branded moment determines how many people will see it and ultimately whether it will be successfully linked to purchase triggers. Even if the brand is placed in the creative early and often, the shape of attention distribution defines the ultimate number of people who see the brand.
Take for example the below. In both examples the brand is present across the entire course of the ad length, so they have diligently followed Ehrenberg-Bass rules of good branding.
Example A: While the attention volume is less than you might expect when reach-based planning (46%), at least the attention decay distribution is relatively flat. This means roughly the same number of people will see your branded moment in each impression on this platform plus at least 100% of the branded moments are seen (even if on average less than half what you expect).
Example B: Not only is the attention volume lower (24%), but the drop off in attention is sharper. In this example 80% of your branded moments are seen by less than 20% of the audience you buy, while close to 50% are seen by no-one.
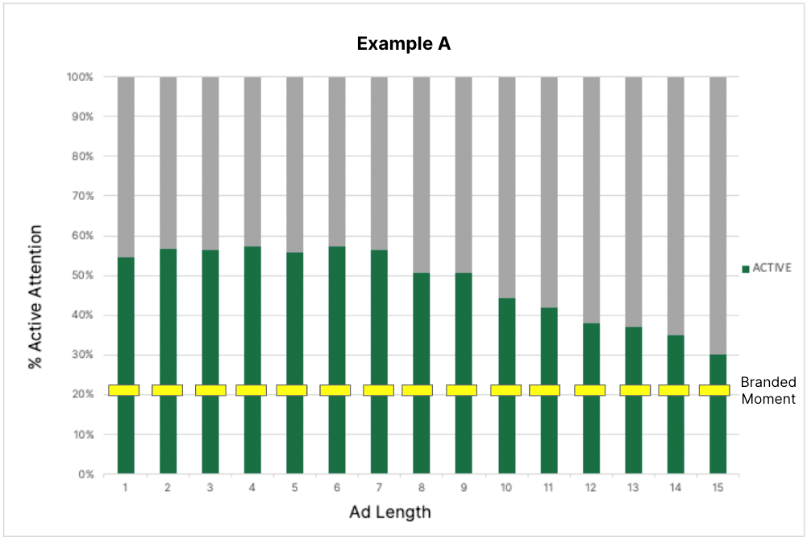
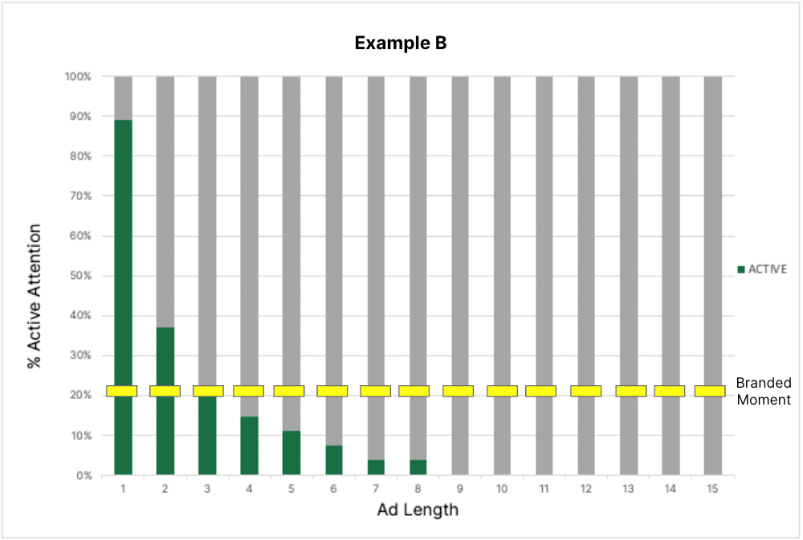
Fig 3. Attention decay and the impact on branded moments.
To further demonstrate this point, here are some numbers from the real world. We took a random sample of 100 brands representing more than 1000 branded moments from digital ads in five countries.
We found that on scrollable and skippable formats, 70% of branded moments appeared when less than 20% of the paid reach volume were watching. Here is the cruncher, we know that when the brand is missing we fill in the gaps, this literally means that your biggest competitor will be reaping the benefit of your advertising.
Summary
While those new to attention economics might find this all a bit confusing, all of this is related.
The gap between viewable and viewed impressions has an impact on how much reach you get, which leads to how often your brand is seen, which leads to how much mental availability you achieve, which leads to how much you spend….repeat.
Good attention data, in the right use cases, restores efficiency in the models and tools used in everyday marketing. This could not be more relevant in ‘2023, The Year of Efficiency’.
