The Feed
Read daily effectiveness insights and the latest marketing news, curated by WARC’s editors.
You didn’t return any results. Please clear your filters.
The Future of Measurement: four key trends
The Future of Measurement: four key trends
The evolution of measurement holds enormous and powerful potential for marketers, if the industry can overcome the state of decision paralysis – in an extensive new report, WARC identifies four areas to focus on with practical steps to help.
WARC’s Future of Measurement report is based on exclusive proprietary data as well as external research and reporting.
WARC members can read the full report here.
If you’re yet to subscribe, you can read a sample of the report here.
Why the future of measurement matters
Third-party cookies will finally be eliminated from online advertising this year, but only a tiny fraction of marketers are conducting holistic measurement, with a majority not using any modelling, explains Paul Stringer, WARC’s managing editor of research and insights, in an introduction to the report.
Four big ideas
The report explores four key trends across different chapters:
- AI and the growth of synthetic data
AI is set to transform market research, but the quality of output is only as good as the reliability of the data put in. Marketers will have to grow accustomed to deploying hybrid approaches. - The third-party cookie countdown
Though 75% of marketers understand their dependency on cookies, many remain unprepared for their end; interoperability of replacement systems is a big concern. - Hurdles in holistic measurement
MMM is a hugely exciting new step in measurement, but it requires some know-how to put into practice. - Closing the sustainability gap
Sustainability requires a more nuanced definition of growth, while new regulations will put pressure on brands to measure the emissions resulting from their activities.
Key quote
“With measurement continuing to evolve in several directions at once, marketers find themselves battling multiple headwinds: not only the demise of third-party cookies, but new regulations in sustainability reporting, and, of course, the growing influence and impact of AI” – Paul Stringer, Managing Editor, Research & Insights, WARC.
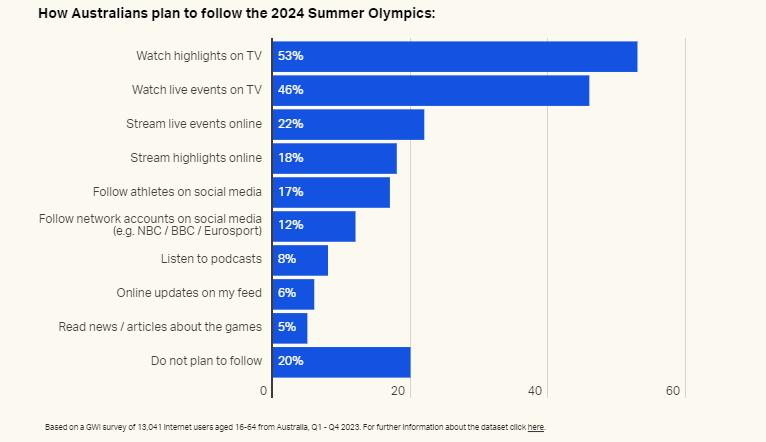
How Australians plan to tune in to the 2024 Summer Olympics
WARC’s latest Spotlight Australia infographic shows that the majority of Australians plan to follow the Olympics this year, with approximately half the country planning to watch either live events (46%) or highlights (53%) on TV, making it the most popular channel for engagement.
Only one in five says they have no plans to watch the sporting event at all.
Why live sporting events matter
Marketers increasingly prize sport for its ability to drive mass reach. Last year’s FIFA Women’s World Cup broke Australian TV viewership records during the Matildas’ semifinal match with England, drawing 11.5 million viewers...
This content is for subscribers only.
Sign in or book a demo to continue reading WARC’s unbiased, evidence-based insights that save you time and help you make marketing choices that work.
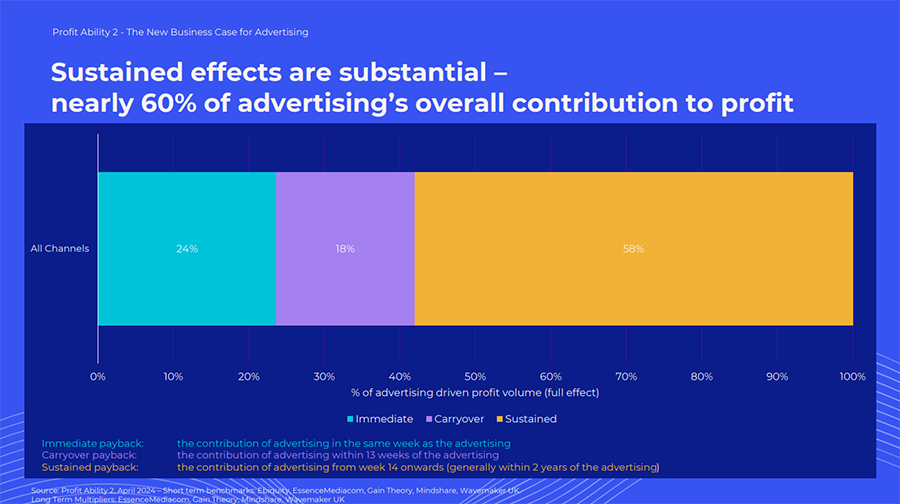
Beyond brand vs performance
Thinking in terms of brand-building or performance-driven channels ignores how advertising really works, say the authors of a major new report into the business effects of advertising spend; instead, there are three critical dimensions that marketers need to start considering.
Why new dimensions of effectiveness matter
Brand and performance have been useful groupings for channels’ respective effects, but at a time when driving value is becoming as, if not more, important than driving volume, the authors believe that much more nuance is needed when planning and modelling the full effect of advertising spend, given the long tail of effects (pictured)....
This content is for subscribers only.
Sign in or book a demo to continue reading WARC’s unbiased, evidence-based insights that save you time and help you make marketing choices that work.
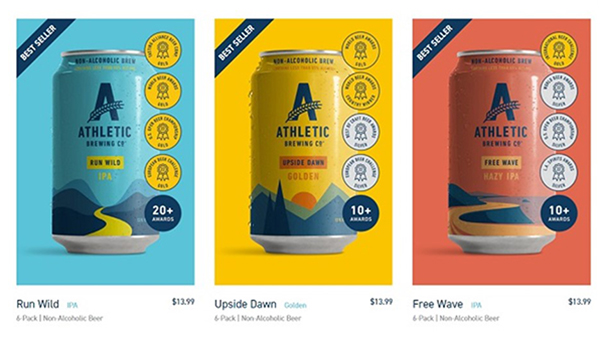
How Athletic Brewing tapped the power of marketing mix models
Athletic Brewing, the non-alcoholic craft beer manufacturer, has tapped into marketing mix models to help find the right balance of growth and profitability.
Why a marketing mix model matters
Rigorously examining budget allocation can help brands better understand how to boost return on investment (ROI) and reduce non-essential spending. Marketing mix models are one way of achieving this objective at a granular level.
- As a seven-year-old company in what has become a fast-growing category, Athletic Brewing faced the challenge of driving growth in a profitable way.
- It partnered with Keen Decision System, an omnichannel marketing mix model provider that also...
This content is for subscribers only.
Sign in or book a demo to continue reading WARC’s unbiased, evidence-based insights that save you time and help you make marketing choices that work.

Connected TV and retail media central to this year’s US upfront
Connected TV and retail media central to this year’s US upfront
The US upfront is expected to be a seller’s market this year because of an improved economy, tighter inventory due to the Olympics and presidential election, and no writer’s strike, according to data from Advertiser Perceptions.
Channels including connected TV and retail media are also expected to be a greater part of the mix.
Why the US upfront sales matters
The annual upfront TV ad sales season in the US is a key indicator of the health of the media and marketing ecosystem, taking into account the popularity of programming, the size of ad budgets, the state of the overall economy, and how new media channels fit into the overall picture.
Takeaways
- Advertising Perception’s (AP) March survey of 156 US advertisers who influence upfront video budgets showed that 34% plan to increase their upfront allocation this year, and anticipate allocating a median of 45% of their upfront video budgets to CTV, up from 40% a year ago. AP believes CTV spending will outpace national linear by 2026.
- Access to media brand data (including retail data) has emerged as the number one reason advertisers say they plan to purchase TV inventory during the upfront, with brands expressing interest in products built on streamers’ first-party viewing data, retailer sales data or ACR (Automatic Content Recognition) data from Smart TV and streaming device providers.
- As currency solutions besides Nielsen receive accreditation from the Joint Industry Committee (JIC), only 41% of advertisers say they plan to transact solely on traditional currencies; 59% plan to use alternative currencies either alongside Nielsen demos or exclusively.
Key quote
“For buyers, CTV will be a more central part of upfront conversations than in years past. And with the Olympics and presidential election this year, advertisers may need to be more aggressive with their plans than in prior years if they want to lock in with specific inventory at guaranteed rates” – Eric Haggstrom, director of market intelligence, AP.
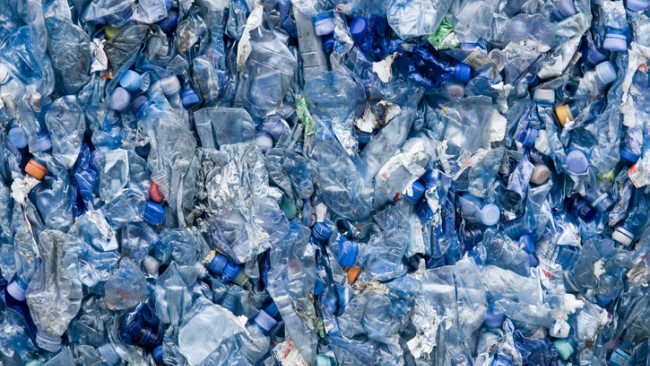
Time for FMCG brands to stand up in the plastics debate
Time for FMCG brands to stand up in the plastics debate
Some of the world’s biggest FMCG manufacturers have been making encouraging noises about how they are addressing the problem of plastic pollution but more radical change is needed than keeping screw tops attached to drinks bottles.
Context
- The UN is aiming to conclude a global plastics treaty by the end of this year which would manage plastics over their lifecycle.
- The Intergovernmental Negotiating Committee on Plastic Pollution has this week advanced discussion from ideas to treaty language, including limiting the total amount of plastic produced.
- Nearly 400 million tonnes of new plastic is produced every year, according to UNEP estimates, and that total could double by 2040; plastic also accounts for 5% of global emissions currently but that could rise too.
- The UN estimates that less than 10% of plastic generated globally gets recycled. And recent research from The 5 Gyres Institute concludes that for every percentage increase in plastic produced, there is an equivalent increase in plastic pollution in the environment.
Takeaways
- The Institute also found that 56 FCMG multinationals were responsible for at least half of the world’s plastic litter (the half of the 1.87 million items collected over a five-year period across 84 countries that had discernible branding); Coca-Cola alone was responsible for 11%.
- Most of the rubbish collected was single-use packaging for food, beverage, and tobacco products.
- In a recent earnings call, Unilever claimed to have reduced virgin plastic use by 18% over the past year, while increasing use of recycled plastic by 23%.
- Tradeable plastic credits, which would allow companies to balance the plastic waste they collect against the waste they produce, are seen as an answer by some companies.
Why plastic pollution matters
Virgin plastic is being produced faster than old plastic is being recycled and the world is awash – literally – with the results. FMCG brands and their single-use plastics are a major contributor to the problem and will play a crucial role in solving it. But as Unilever CEO Hein Schumacher noted, brands can’t do it alone: “You need the cooperation of retailers [on refill and reuse], you need the cooperation of governments in terms of law change.”
Sourced from Guardian, Financial Times, Globe & Mail, Seeking Alpha, AP
UK consumers concerned about political advertising
UK consumers concerned about political advertising
Data from UK advertising thinktank Credos shows 44% of people are concerned about political advertising, with people significantly less likely to trust political advertising (29%) than all/commercial advertising (39%).
Key stats
- Almost three-quarters of people (73%) believe that political advertising should be subject to the same rules and regulations as other forms of advertising (12% disagree and 14% don’t know).
- Two in five people (39%) believe there is too little/no regulation, while a third (33%) think it’s about right, 10% think there is too much, and 18% don’t know.
- Young people are most likely to trust political advertising (48% of 18-34s compared to just 13% of over 55s), but also had the highest levels of concern (49% of 18-34s compared to 44% of all people, 46% of 35-54s and 38% of 55+).
Why political advertising matters
With local elections in the UK this week and a general election expected within months, political advertising is a topical issue. In this climate, parties dispute the veracity of each other’s material and the editing of video destined for social media often presents a misleading picture of the other side’s intentions.
And the problem extends well beyond the UK. In Europe, regulators may be about to open a probe into Facebook and Instagram over concerns that Meta’s brands are not doing enough to counter disinformation coming from Russia and other countries that could undermine upcoming European Parliament elections.
What next?
- Media Smart, the advertising and media industry’s education programme, has partnered with the Advertising Association, the UK advertising industry trade body, to publish What’s the deal with political advertising?.
- The new 10-point guide aims to help people, especially young people preparing to vote for the first time, improve their political literacy and understand the ads they see.
- An awareness campaign will be delivered via AA and Media Smart channels online to help promote the guide, as well as through five ad executions in 300 universities and colleges through a partnership with Next-Gen Media.
Sourced from Media Smart, Financial Times, Huffington Post

Brand admin costs UK consumers £3bn a year
Brand admin costs UK consumers £3bn a year
Almost half of Brits (49%) consider brand admin (‘brandmin’) – tasks to manage their accounts or interactions with brands – to be a significant chore, but choosing to save time by ignoring it costs money.
That’s according to research from custom engagement platform Twilio which identified the most irritating experiences consumers have to endure and which have led to around half having lost their patience or becoming emotional.
‘Brandmin’ time drains
- Being put on hold (43%)
- Being passed around departments or incorrectly transferred (43%)
- Lengthy resolution processes (27%)
- Multi-factor authentication (25%)
- Complicated returns processes (22%)
- Being forced into interactions on channels they don’t want to use (18%) or having to reach out at inconvenient times (19%)
Time is money
- UK consumers spend 45 minutes a week on average on such ‘brandmin’ tasks, amounting to over 1.5 days a year.
- Almost half (47%) have given up on such tasks entirely, citing the time taken or the frustrations endured.
- Brits lost an average of £95 each in the last year at their expense – or £3bn collectively.
Why brandmin matters
Negative brand experiences inevitably have an effect on loyalty and word of mouth, as consumers complain to family and friends and choose to take their business elsewhere.
So what’s the answer?
- While it’s no surprise that brands will reach for AI to help create more streamlined customer engagement, it seems that consumers are also banking on new tech to solve the problems created by old tech.
- Over the next 12 months, customers are hoping AI can shorten waiting times (34%), provide 24/7 customer service availability (34%), put them through to the correct department the first time (28%), automatically verify their identity (22%), streamline or automate changes or cancellations to contracts (18%), or streamline resolutions to complaints and product faults (17%).
Key quote
“Brands need to rise to the occasion and remove the ‘time drain’ tasks that seem to go hand-in-hand with being a customer. Helping customers reach resolutions is the answer – it’s as simple as that” – Sam Richardson, Customer Engagement Consultant at Twilio.
Sourced from Twilio

Marketers need more AI training
Most people in the digital marketing industry are already using or experimenting with GenAI, but there’s a need for more training, according to new research from IAB Europe.
The industry body partnered with Microsoft Advertising for a survey* that leveraged IAB Europe’s network of national IABs and corporate members.
Key findings
Generative AI (GenAI) is set to revolutionise digital advertising by automating tasks, personalising content, and enabling data-driven decisions.
- Nine in ten (91%) respondents are already using or experimenting with GenAI.
- Four in ten (41%) have a specific budget assigned to experiments with and using GenAI.
- Half are fostering AI talent within the team (e.g. upskilling current teams and hiring new talent).
- Additionally, almost one-third said that their company is providing dedicated days and time for team members to learn about AI.
Beyond operational streamlining, professionals are increasingly leveraging generative AI for content creation and creative endeavours.
- More than two-thirds of respondents said they were using GenAI within their business to develop content.
- Half were using it to develop creative.
The study also highlights a clear demand for enhanced education within the industry:
- Nine in ten (89%) respondents called for more training initiatives.
- Additionally, it emphasises the importance of transparency and trust, as stakeholders navigate the integration of AI technologies into their workflows.
Why GenAI training matters
Marie-Clare Puffett, insights & industry development director of IAB Europe observes that while embracing GenAI is essential for staying ahead of the curve, it’s also necessary to address educational gaps and to foster transparency if stakeholders are to harness the full potential of the technology.
*There were 146 responses to the survey, with nearly 50% of respondents having over ten years’ experience working in the digital advertising industry across a variety of departments and markets in Europe.

How Santander is embracing ‘sanpo yoshi’
Santander has a close relationship with agency group Dentsu, which is proving mutually beneficial as the banking group adopts elements of Japanese business philosophy.
Why 'sanpo yoshi' matters
Sanpo yoshi is the Japanese concept that believes business transactions ought to deliver three-way satisfaction, by being good for people, good for society and good for business – a win-win-win idea that feels more relevant today than ever.
Takeaways
- The bank is moving away from undifferentiated product campaigns, using its own rich data to bring a more personalised and relevant experience to clients.
- Understanding that the key ‘persona’ to be targeted...
This content is for subscribers only.
Sign in or book a demo to continue reading WARC’s unbiased, evidence-based insights that save you time and help you make marketing choices that work.
Nestlé touts strong innovation pipeline
Food giant Nestlé has highlighted its strong innovation pipeline for 2024 – in the US alone, its Purina pet care brand plans to launch over 100 new products – and stressed that this will be supported by marketing investment.
What’s happening
- “Compared to ‘23 [innovation] levels, we are particularly strongly spring-loaded for the year ‘24,” CEO Mark Schneider told an earnings call.
- “To back up our expanded innovation pipeline, we are focused on fuelling growth through increased advertising and marketing investments to support stronger consumer engagement,” he added.
- “As the effect of marketing and promotional investment builds, we expect our efforts to continue to translate into strengthened market share positions,” Schneider elaborated.
Why innovation matters
Innovation is necessary to keep consumers interested in categories and brands and to drive differentiation. As Schneider noted, when innovation drops off, that can help private label competition. “It’s important to keep the innovation renovation engine running,” he said.
Where Nestlé is innovating
- Examples of innovation include introducing Stouffers and Lean Cuisine options into the sandwiches segment (where the advent of the air fryer is “making a big difference”, according to Schneider).
- Launches are also planned for the emergence of new segments tailored to diabetes and GLP-1 consumers and those looking for healthy food options on their weight loss journey.
- In the US vitamins, minerals and supplements business, “a full innovation roster” will include a particular focus on building out new segments by leveraging the company’s expertise in probiotics and healthy aging.
- During Q1, Nestlé’s ‘billionaire brands’ grew twice as fast as the group’s average. “Brands like Fancy Feast, KitKat and Maggi are at the core of our category strategies and are critical to our success as vehicles for scaling innovation into growth opportunities across geographies,” said Schneider.
Context
- In 2020 and 2021, new launches already in train were able to continue during the initial period of the Covid pandemic, but by 2022 supply chain constraints meant the focus was on simply maintaining the presence of core products on shelves.
- That picture began to change over the course of 2023 as post-pandemic normalization settled in.
Sourced from Seeking Alpha
[Image: Nestle]

Hyperlocalization boosts Nike in China
Hyperlocalization boosts Nike in China
Global sportswear titan Nike has enjoyed a sustained period of growth in China with a localized innovation strategy that maintains the brand’s core DNA by investing in and accelerating its technology.
Why Nike in China matters
For Western brands working in China, the competition has never been more ferocious as established players as well as local upstarts chase value growth despite broad challenges. The difference with China, as opposed to other important territories, is that the speed of innovation required in the country pushes even major creative brand marketers to the limit.
What’s going on
China is big business for Nike, which enjoyed 6% year-on-year growth in the country for Q3, a six-quarter run of growth, China Daily notes.
"We're doing things to accelerate how quickly we can respond to the consumer. China's really the market where we're doing that the most. We're leaning in, trying new ways to pull forward innovations and get them in the market," explained CEO John Donahoe in comments to investors.
"We are going to speed up the innovation cycle for each season and each product based on the market feedback," he added. "We believe that Chinese consumers are ahead of the rest of the world in many ways. We take learning from China to the rest of the world."
In response, the firm has invested in a Shenzhen-based technology center with a China focus, as well as other logistical investments to improve its speed to market. This adds to a Sport Research Lab set to open in Shanghai this year.
In context
Since the pandemic, consumers around the world have grown more interested in forms of exercise that require no (or very little) equipment, such as running or yoga, both categories in which Nike has some interest.
- As a result, the focus of Nike’s innovation has turned away from an enhanced direct-to-consumer model championed last year and toward differentiation around performance and technology.
- Across the business, the product mix is starting to move away from the lifestyle categories that had formed the bulk of the business – since January, growth in the performance segment has outpaced lifestyle.
- It also mixes with a deeper trend of fashion and performance sportswear and brands meeting in an incredibly fruitful market. However, the trend has also foregrounded niche and high performance brands at the potential expense of mass-market leaders like Nike.
Sourced from China Daily, Seeking Alpha, WARC

Global brand ads give credibility to pro-Kremlin media
Global brand ads give credibility to pro-Kremlin media
A group of European parliamentarians has warned 15 global brands that they should stop advertising on certain media in Serbia and Bulgaria.
In a letter, seen by Politico, the MEPs advise the brands to “rigorously review advertising policies to ensure that your expenditures do not, even unintentionally, fund outlets known for disseminating harmful disinformation”.
Why it matters
“Many media organisations that promote pro-Kremlin disinformation often use advertising bought by reputable companies to strengthen their credibility,” Bulgarian conservative MEP Andrey Kovatchev, one of the letter’s signatories, told Politico.
Brands shouldn’t ignore the possibility that their money is, unwittingly, funding such disinformation; they may need to take a more active interest in where ad tech is placing their advertising.
Takeaways
- Serbian stations such as TV Pink and TV Happy rely heavily on advertising revenue from international companies and these have claimed, for example, that Russia was “was forced” into conducting a “special military operation” in Ukraine.
- The 15 companies addressed in the letter include Lidl, Ahold Delhaize, Procter & Gamble, Coca-Cola, A1, Yettel, Ferrero, Heineken, Mars, Mondelēz, L’Oréal, GSK, Bosch, Samsung and Amazon.
- A spokesperson for GSK told Politico the company didn’t advertise in the Balkans, while Lidl said it has wound down advertising on the two Serbian stations above and stopped on one altogether in 2024.
Death and taxes
- European banks have also been questioned for paying some €800m in taxes to the Kremlin last year (roughly half of that from Austria’s Raiffeisen Bank International); the Financial Times reports this is 4x more than before the invasion of Ukraine.
- Western banks require the personal authorisation of President Putin to sell their Russian operations but only seven of 45 have received that; meanwhile they can’t access cash earned in Russia but are earning profits from interest rates that have almost doubled since the war started and are paying tax on those higher profits.
Sourced from Politico, Financial Times
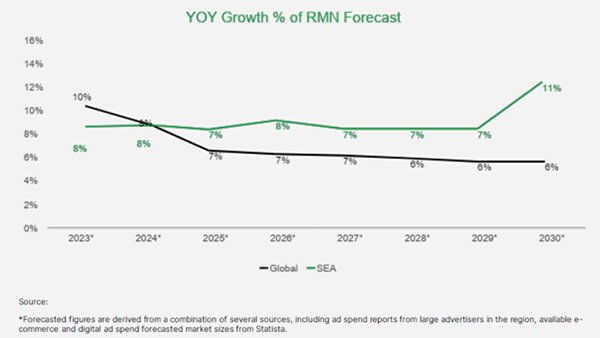
SEA’s retail media ad spend projected to grow 11% by 2030
SEA’s retail media ad spend projected to grow 11% by 2030
Advertising spend on Retail Media Networks (RMNs) in Southeast Asia is projected to hit US$4.7 billion by 2030, underscoring the increasing significance of this channel for advertising, according to a report by GrabAds and Kantar.
Why RMNs in SEA matter
Southeast Asia is positioned for RMNs to flourish. With a fast-growing digital economy and increasingly tech-savvy population, it’s primed for brands to “close the loop” and use first-party data to build brand equity, increase share of voice and drive sales growth.
Four types of RMNs in SEA by purchase stage
- Impulse and WOM: Social media RMNs are digital marketplaces within social media platforms. Ads entertain and complement user-generated content to work on building awareness. Examples include TikTok Shop, YouTube Shopping, Facebook Marketplace, LINE Shopping and Instagram Shops.
- Price-motivated: E-commerce RMNs are digital retail marketplaces that offer advertising spaces. Ads here typically feature promotions or discounts to encourage purchase. Examples include Shopee, Lazada, Carousell, Bukalapak, Tokopedia, JD and Amazon.
- Trial and repeat: Large retailer RMNs have a physical retail space. Similar to e-commerce RMNs, ads here typically feature messages that induce consideration or purchase. They are useful to promote trials of new products and include FairPrice, Happy Fresh and Astro as examples.
- Versatile: Superapp RMNs consist of an ecosystem of services that allows curated ads to be served at different purchase stages and types of services. Superapps also boast an integrated payment system that captures offline and online transactions. Examples include Grab and WeChat.
Market breakdown
Indonesia is forecast to lead in RMN ad spend with a projected 13.41% CAGR. Vietnam follows at (12.37%), Thailand (11.76%), Philippines (9.29%), Singapore (8.79%), and Malaysia (7.82%).
Key quote
“The very nature of the RMN ecosystem, which covers the entire customer journey of the funnel, fulfils the goal of tracking and achieving ROAS. This is why RMNs have become a global phenomenon, attracting interest from retailers and marketers worldwide” – Ken Mandel, Regional Managing Director, GrabAds & Brand Insights.

How Colgate used behavioural science to tweak APAC campaign
Colgate Palmolive turned to behavioural science when its Optic White O2 whitening toothpaste campaign needed to be tweaked for the various markets in the Asia Pacific region.
Why behavioural science matters
Behavioural science is based on the pre-established beliefs and cultural contexts that influence consumer decisions. Brands can use it to tailor communications to align with these beliefs and leverage them so as to connect with consumers.
Takeaways
- Whitening may be popular globally but attitudes vary in Asia, where different cultures influence different beliefs, such as the notion that revealing white teeth during a meeting is a way of showing...
This content is for subscribers only.
Sign in or book a demo to continue reading WARC’s unbiased, evidence-based insights that save you time and help you make marketing choices that work.
Alcohol sector lacks sonic assets, finds study
Alcohol sector lacks sonic assets, finds study
Expensive licensing and uninspiring stock music have primed the alcohol sector for an overdue investment into owned sonic assets, finds a study.
Sonic branding agency Amp had its research and insights team analyse and rank the top 50 alcohol brands by their use of music and sound over the last 12 months based on the top five brands from each sector by market share.
Why sonic assets matter
Strategic use of sound can enhance authenticity and foster cognitive function by tapping into nostalgia, driving salience and generating long-term consumer connections; alcohol brands that leverage sonic branding will be front of mind.
Key insights
- Pilsner Urquell, with 27% owned music usage, leads the market in sonic performance and is the only bestselling brand with a sonic logo.
- Havana Club, Michelob Ultra, Belvedere and Modelo round out the top five ranking with descending sonic scores.
- Beer brands performed well in the analysis, claiming 50% of the top 10 slots in the ranking.
- The alcohol industry is composed of many sub-sectors, all delivering different experiences targeted at distinct demographics.
- Brands have been crafting quality products from champagne to hard seltzer with impressive visual identities aimed at target audiences; but from heritage bubbly to flashy fizz, both sub-sectors struggle in the sonic department.
- Champagne brands use a combined 90% “stock music” and “no music” in external marketing communications.
APAC consumers most willing to pay more for sustainable hotels
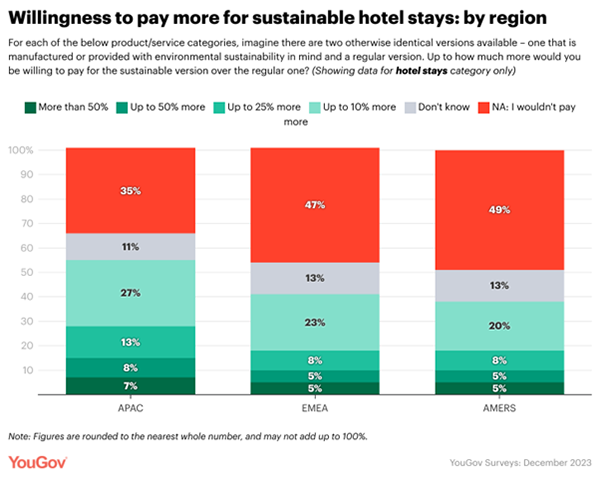
APAC consumers most willing to pay more for sustainable hotels
APAC consumers are more likely than those in EMEA and AMER to pay more for sustainable hotels, YouGov research has found.
Headline figures
- YouGov surveyed 17 international markets and found that over half of consumers in APAC (55%) say they are willing to pay more to stay at an environmentally sustainable hotel compared to a regular one.
- This compares with only around two-fifths (41%) of consumers in Europe, the Middle East and Africa; and 38% in North, Central and South America.
Why sustainable hotels matter
Amid stronger demand for sustainable travel and responsible tourism in Asia Pacific, brands in the region that invest in eco-friendly hotels by building them, or retrofitting existing properties to make them greener, can appeal to those willing and able to pay more for such accommodation.
Key insights
- Consumers who are willing to fork out a 10% green premium make up around a quarter in APAC (27%) and EMEA (23%) but just a fifth in AMER (20%).
- The percentage of those willing to spend over 10% more to stay at eco-friendly hotels makes up 28% in APAC compared to 18% in EMEA and AMER.
- Consumers who resided in the UAE, India, Indonesia, Hong Kong and Mexico were more likely than not to express willingness to pay more for a sustainable hotel stay.
- 73% of UAE consumers are willing to fork out more, ahead of almost seven in 10 Indian consumers (69%), and three in five consumers in Indonesia, Hong Kong (both 61%) and Mexico (60%).
- Those willing to spend over 10% more for a greener hotel booking made up almost half of consumers in the UAE (48%), two-fifths in India (39%) and a third in Indonesia (32%).
- Among markets in Europe, Italy has the highest proportion of consumers who are willing to pay more for a sustainable hotel stay at 45% – above the international average (43%).
- The willingness to spend more to stay at eco-friendly hotels stands at around two in five in Australia and Singapore (both 42%), and Spain (41%).
- Poland and Denmark are both at 38%, and Sweden is 37%, while it is one in three in Britain (36%), Canada (35%), Germany (35%), and France (34%), ahead of just 28% in the US.
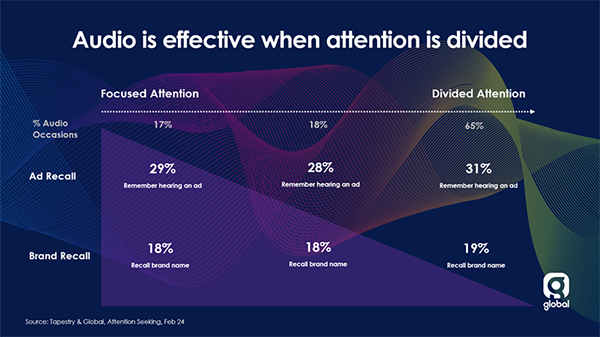
Audio media effective ‘regardless’ of attention levels
Audio media effective ‘regardless’ of attention levels
Audio ads can be effective no matter the level of attention a listener provides, a new study claims, surprisingly finding that people whose attention is divided have slightly better ad recall than those who are more focused.
A two-pronged approach
Ailsa Mackenzie, group strategy director at audio and OOH media owner Global, shared the new research at The Future of Audio and Entertainment conference in London.
Global first undertook a lab-based neuroscience study, measuring participants’ responses to an ad break when just listening, and then when carrying out a task at the same time. The media owner then applied the neuroscience metrics to a diary research project to understand the audio-listening behaviours of over 3,000 people.
Key insights
- Listeners tend to give more “focused attention” to audiobooks and podcasts, with music, radio and streaming more likely to be listened to in tandem with other activities.
- More focused listening occurs mostly during leisure time in the evening, whereas attention tends to be more divided when commuting or working during the daytime.
- Levels of ad and brand recall were found to be slightly higher for those with divided attention: 31% remembered hearing an ad while carrying out another task versus 29% offering more focused attention.
- The study also found “stronger neuro responses to brand moments” when attention was divided (+18% stronger engagement, +204% stronger activation).
Why measuring audio attention matters
It’s a point that has been made previously by organisations including Thinkbox, namely that eye-tracking techniques fail to fully capture the relationship between audio media and consumer attention. Studies like this help to fill the gaps in advertisers’ understanding of the role of non-screen-based media on attention.
Key quote
“Attention is shared across our senses and activities, in a constantly changing balance. But the answer isn’t to create campaigns that demand more attention. We need to change the narrative to make the most of the attention we’ve got” – Ailsa Mackenzie, Group Strategy Director, Global.
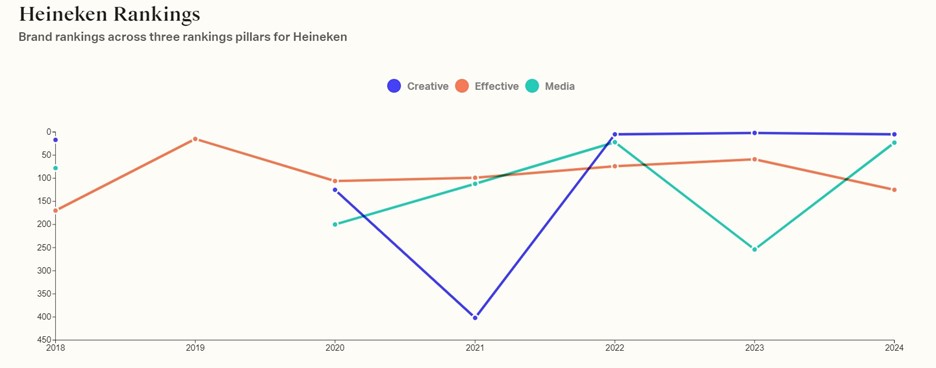
WARC Creative: unpacking Heineken’s marketing evolution
WARC Creative: unpacking Heineken’s marketing evolution
Heineken has consistently ranked among the top brands for creativity with its highly recognised campaigns, but the brand has struggled to match the same level of success when it comes to effectiveness and media, analysis reveals.
This profile, available exclusively to WARC Creative members, examines the performance of Heineken in the WARC Rankings and explores the approach it has taken to marketing, comparing it to WARC’s comprehensive set of creative effectiveness frameworks.
Why Heineken matters
Heineken is one of the most recognisable and valuable alcoholic drinks brands globally. In terms of its advertising efforts, it is renowned for its creative campaigns, which frequently appear in the Creative 100. Since 2022, the brand has consistently held a position in the top 10.
In last year’s Creative 100, Heineken came second for the most creative brand globally, with four of its campaigns in the top 100. While Heineken hasn’t replicated the same level of success in the Effective and Media 100, it has achieved some impressive results over the years, peaking at 15th in the 2019 Effective 100 and 23rd in both the 2022 and 2024 Media 100.
Takeaways
- In 2022, the campaign ‘Shutter Ads’ ranked no. 7 in the Creative 100 and no. 38 in the Media 100. Its success continued into the following year, ranking 25th in the Creative 100. It was created to support Heineken’s trade partners through the pandemic by turning bars’ closed shutters into media space.
- Heineken places a significantly higher emphasis on creating informative and educational content than the wider industry does: 37% of Heineken’s campaigns have this strategy compared to just 23% for the industry.
- Over a quarter of Heineken’s campaigns lead with mobile and apps, more than any other channel. In contrast, the wider industry predominantly favours television and connected TV as the lead channel for its campaigns.
Go deeper
WARC Creative members can access the full analysis, complete with rich analysis of the brands campaign objectives and results, in-depth explorations of the work and of Heineken's competitive environment.
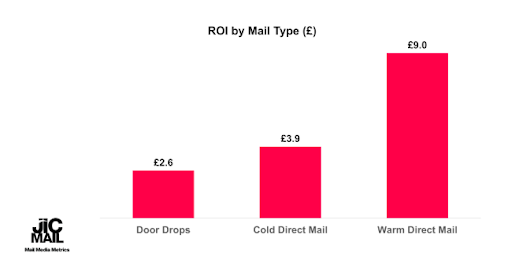
JICMAIL adds door drop data to its benchmarks
JICMAIL adds door drop data to its benchmarks
The latest JICMAIL Response Rate Tracker reveals that the average warm direct mail campaign has a response rate of 7.9%, cold direct mail 0.9% and door drops 0.6%.
Background
Last March the industry body assessed for the first time how responsive consumers are to acquisition- vs retention-based marketing strategies with mail. Its new research is based on more than twice as many campaigns from an increased number of organisations and now includes data on door drops.
Why mail benchmarks matters
The benchmarks are a useful tool for advertisers to understand where direct mail sits in the wider marketing ecosystem. JICMAIL’s Ian Gibbs, director of data leadership and learning, adds: “Having accurate benchmarks by which to set targets, track relative performance, and validate measurement results are all crucial steps in making the most out of a performance-oriented Direct Mail or Door Drop campaign.”
(And they will also complement the Thinkbox study published this week which breaks down the profit generated by advertising in various channels but which doesn’t include direct mail).
Key stats
- Warm DM has over double the ROI of cold DM (£9.00 vs £3.90) due to higher response rates and 80% lower CPAs (but cold DM is a vital channel for customer acquisition).
- Average Order Value is over x2.5 higher for cold vs warm DM, pointing toward the high value that a new customer obtained via mail can bring to an organisation once the heavy lifting of acquisition is done.
- With an average response rate of 0.6% and ROI of £2.60, door drops can also be an important mail channel for customer acquisition and are being used to good effect by a wide range of advertising sectors.
- The highest response rates for warm direct mail are found in the medical category (25.9%), while for cold DM, the highest rates are found in the Retail / Online Retail and Mail Order sectors (1.0%).
- For door drops, the highest response rates were found in Retail / Online Retail (3.0%).
Sourced from JICMAIL
Email this content
